Same exclusive area, different opinions
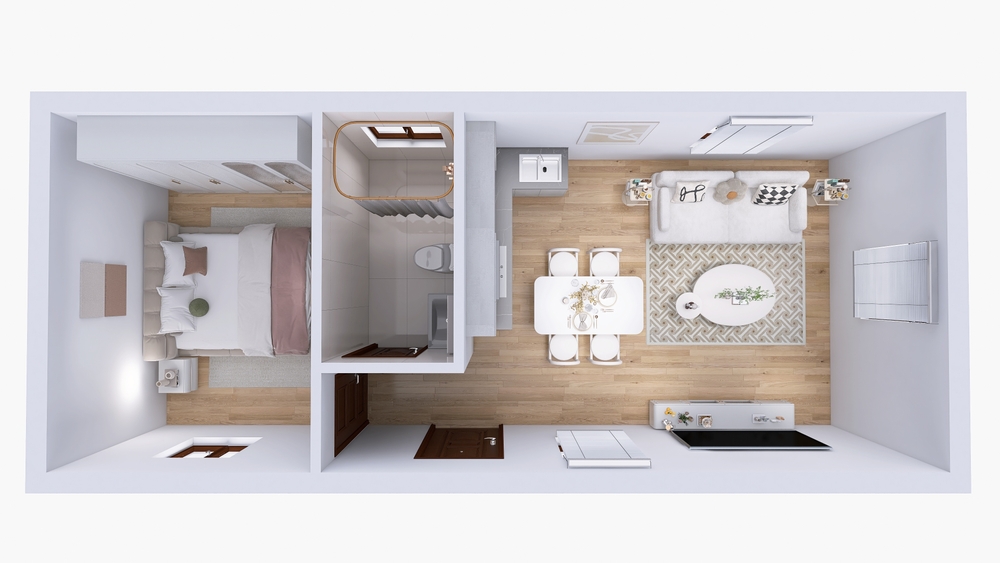
Working in the field of leasing, there is something I experience repeatedly. It is the fact that even when showing offices with the same conditions, tenants' reactions vary every time. For example, an exclusive area of 165.29㎡ (old When showing people around various offices with the same condition of 50 pyeong, some say, “This one looks much wider,” while others say, “It’s narrower than I expected.” The numbers written on the contract are identical. However, the space felt by the body is different.
It is said that numbers are honest. However, in the real estate field, honest numbers often lead to misunderstandings. The figure of 165.29㎡ of exclusive use area alone does not determine anything about what that space will look like. Depending on where the pillars are located, where the core is concentrated, and how much window space is available, the same number can result in a completely different space. And behind this perceived difference lies another number: the exclusive use ratio.
Numbers that no one announces
 The exclusive use rate refers to the ratio of the exclusive area actually used exclusively by the tenant to the total contract area (rental area).
Since the contract area is the sum of the exclusive area and the common area—lobby, corridor, restroom, machine room, elevator hall, etc.—the exclusive use ratio varies significantly even with the same contract area depending on the building's core structure, the number of elevators, and the size of the lobby.
However, there is an interesting point. While global real estate service firms such as CBRE, JLL, Cushman & Wakefield, and Savills, which regularly survey the Seoul office market, publish detailed quarterly figures on vacancy rates, rents, and net absorption area, they do not officially release the average usable area ratio by grade anywhere. The very figures that tenants are likely most curious about before signing a contract do not exist as official statistics in the market.
This gap is no coincidence. The exclusive use ratio varies significantly from building to building, and the criteria for defining common area differ, making it difficult to summarize into a single average value. Ultimately, the exclusive use ratio is an extremely field-oriented figure that can only be verified by directly examining individual buildings. The very fact that it is not included in statistical tables is the first signal that this figure should be treated as an indicator to be interpreted relatively, rather than as an absolute standard.
Decisions to lower the occupancy rate
The exclusive use ratio of a building is a number determined by the core, lobby, and elevators, so tenants cannot change it at will. Interestingly, however, the same structural choice is taking place on a much smaller scale. Within their allotted exclusive area, companies are asking themselves, inside their offices, the exact same question that landlords determine regarding the exclusive use ratio: how much to keep entirely for themselves and how much to give up for shared use.

L'Oréal Korea deliberated on whether to renew its lease for the ASEM Tower in Samseong-dong, Seoul, ahead of its expiration, but ultimately chose to completely renovate the existing space. By introducing a flexible seating system instead of assigned desks, the company widened the spacing between desks and significantly expanded multi-purpose spaces that combine a café with work and meeting functions. This move was driven by the shift in hybrid work environments, where the purpose of commuting has become more about collaboration than individual tasks. Although the density of dedicated individual desks has decreased, employee satisfaction and usage have been assessed as high since the move.
Toyota Korea reduced its office space by 60 percent as it relocated from Gangnam to Euljiro Center One. Instead, the spacing between seats was actually widened. This decision reflected the fact that, given the organization's large sales workforce, employees frequently visit the office for meetings rather than sitting at their desks.
Volvo Group Korea reduced the office space at its Hannam-dong headquarters from five floors to three. This was not merely a simple reduction, but the result of reconfiguring the space into a hybrid office featuring a flexible seating system and sixteen different workspace concepts. The design includes focus rooms and dual-monitor desks for individual intensive work, while utilizing folding doors to allow for the conversion of large town halls into small team meeting spaces depending on the situation.
 Columbia Sportswear completely relocated its business district. By closing its existing office and moving to the vicinity of Seongsu Station, it significantly reduced its workspace area from approximately 2,900 square meters to approximately 1,000 square meters.
A clear trend runs through the decisions of these four companies. They reduced the contract area or lowered the density of the exclusive use area, while filling that space with functions for meetings, collaboration, and relaxation. While this choice may appear to be a step backward when considering only their exclusive use ratios, it is actually interpreted as a move to improve the quality of the space.
Optical illusion behind the numbers
A few days ago, I had a consultation with the CEO of a B2B distribution company in Gangnam regarding office issues. The company, which has nearly 200 employees, said it is considering expanding and relocating to a larger office space following continuous requests from employees regarding a shortage of meeting rooms.
Just as I was preparing this manuscript, one piece of data caught my eye. It was the case of a domestic financial company. Although the number of executives was less than 5 percent of the total workforce, their offices occupied 20 percent of the total office space. When converted to area per person, this figure exceeds 9.9174 square meters (approximately 3 pyeong), yet the actual workspace felt by the employees was cramped. In a sense, behind the average value of the occupancy rate lies another story regarding to whom and how that space was allocated.

It was said that a similar illusion was repeating regarding meeting rooms. According to experience consulting for various companies, when employees were asked, “What is the most lacking facility?” the answer was consistently “meeting rooms.” However, when actual meeting room occupancy rates were investigated during peak hours, in most cases, they did not exceed 60 percent at the highest.
At one foreign IT company, complaints about a shortage of meeting rooms poured in, yet the actual occupancy rate reportedly stood at only 43 percent. This was because there were so many no-shows after making reservations. In essence, one’s perception is determined solely by whether the meeting room right in front of them is empty, while it is unrelated to the actual utilization rate of the entire building.
Therefore, I advised the B2B distribution company to first examine the actual occupancy rate of their current meeting rooms rather than rushing into expansion and relocation. Simply informing them that such a gap between perceived usage and actual utilization is common provides grounds for reconsideration before reaching a conclusion to expand.
The question of the occupancy rate

Ultimately, the utilization rate is not a number that provides the answer, but rather akin to a starting line where questions and contemplation begin. How many people arrive at work simultaneously? Do they work sitting at their desks or meeting in person? How often are meetings held, and how long do they last? Until the answers to these questions are organized, the utilization rate is like an unnamed gesture. The moment we attach the organization's questions to that number, give it a name, and interpret it—only then does the utilization rate finally become a space that suits us.
The role of a leasing expert also changes at this point. They should not be someone who simply finds properties with high usable area ratios, but rather someone who helps interpret what that number means for the organization. In the next installment, we will take this question a step further to examine how office spaces should actually vary depending on the industry and organizational characteristics—and look into the stories of several companies that have already put these answers into practice.