<Buying and Selling

In July 2026, the nationwide housing sales price index continued its upward trend, rising 0.351 TP3T from the previous month. The metropolitan area rose 0.721 TP3T, while provincial areas rose 0.011 TP3T, clearly showing a difference in price trends between the metropolitan area and provincial regions.
In particular, Seoul recorded the highest increase nationwide with a rise of 1.091 TP3T, and also increased by 9.721 TP3T compared to the same month of the previous year. In Seoul, the increase was significant, centered around non-Gangnam areas, including Seongbuk-gu (1.731 TP3T), Nowon-gu (1.641 TP3T), Jungnang-gu (1.351 TP3T), Guro-gu (1.331 TP3T), Gangdong-gu (1.291 TP3T), Yeongdeungpo-gu (1.271 TP3T), and Seodaemun-gu (1.261 TP3T).
Gyeonggi also rose by 0.651 TP3T, with notable increases in major areas such as Hwaseong Dongtan-gu (3.301 TP3T), Suwon Yeongtong-gu (2.461 TP3T), Yongin Giheung-gu (1.961 TP3T), and Seongnam Bundang-gu (1.911 TP3T). On the other hand, Incheon rose by only 0.021 TP3T.
In the provinces, Ulsan rose by 0.301 TP3T, Jeonbuk by 0.151 TP3T, and Chungbuk by 0.131 TP3T, while Chungnam (-0.101 TP3T), Gyeongbuk (-0.081 TP3T), Daegu (-0.081 TP3T), and Jeju (-0.181 TP3T) declined. Overall, while the upward trend in key areas of Seoul and Gyeonggi is driving the national market, regional differentiation continues in the provinces.
<Jeonse
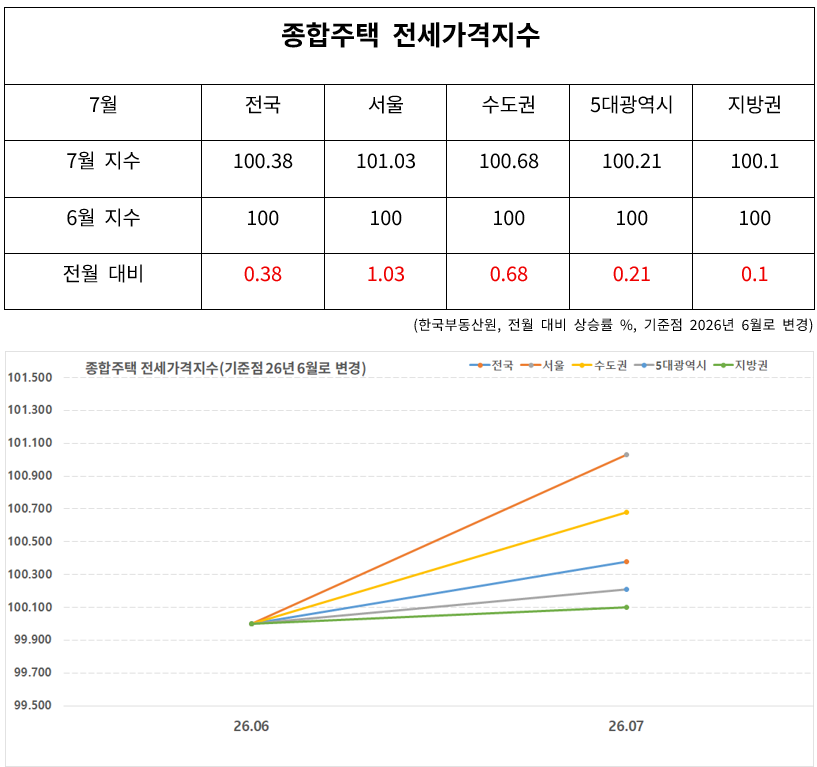
In July 2026, the nationwide Jeonse price index rose by 0.381 TP3T compared to the previous month, with the metropolitan area rising by 0.681 TP3T and the provinces by 0.101 TP3T.
Seoul rose by 1.031 TP3T, significantly exceeding the national average just like sales prices, and the year-on-year increase reached 7.151 TP3T. In Seoul, the increase was relatively large in the Gangbuk area, including Nowon-gu (1.691 TP3T), Seongbuk-gu (1.481 TP3T), Gangbuk-gu (1.391 TP3T), Seongdong-gu (1.351 TP3T), and Dobong-gu (1.271 TP3T), while Gangdong-gu (1.531 TP3T), Songpa-gu (1.451 TP3T), Geumcheon-gu (1.131 TP3T), Yeongdeungpo-gu (1.111 TP3T), and Guro-gu (1.061 TP3T) also showed high growth rates.
Jeonse prices in Gyeonggi Province rose by 0.551 TP3T, with Gwangmyeong City (1.791 TP3T), Hwaseong Dongtan-gu (1.681 TP3T), and Yongin Giheung-gu (1.521 TP3T) leading the increase. Incheon also rose by 0.271 TP3T.
In regional areas, Ulsan (0.451 TP3T), Sejong (0.351 TP3T), Busan (0.211 TP3T), Jeonbuk (0.201 TP3T), and Gyeongnam (0.161 TP3T) rose, while Daegu also shifted to an upward trend of 0.051 TP3T. Conversely, Gyeongbuk fell by -0.021 TP3T and Jeju by -0.161 TP3T. Amidst sustained rental demand, the upward trend in Jeonse prices appears to be expanding, centered on areas with favorable living conditions such as station areas and large-scale complexes.
<Monthly Rent >
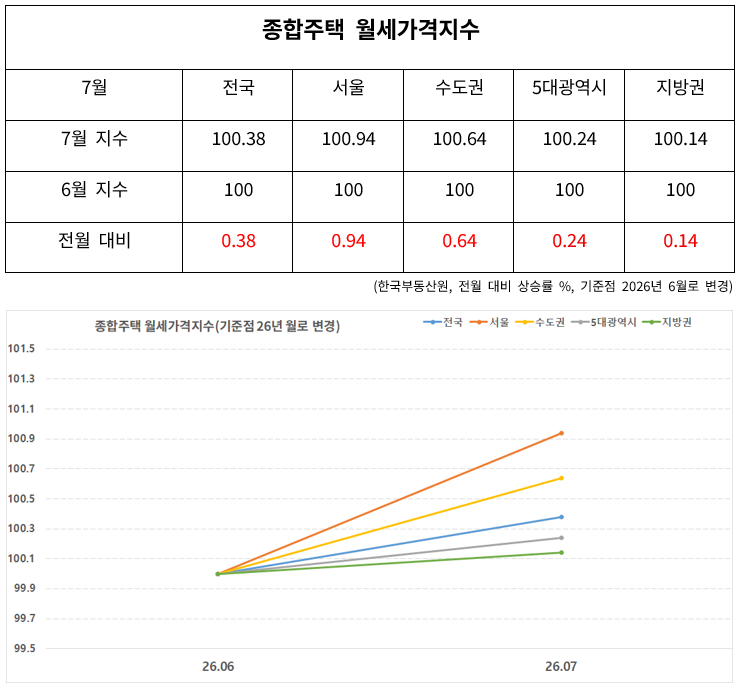
In July 2026, the nationwide integrated monthly rent price index rose by 0.381 TP3T compared to the previous month. The Seoul metropolitan area rose by 0.641 TP3T and the provinces by 0.141 TP3T, indicating that the increase in the monthly rent market was also significantly greater in the metropolitan area than in the provinces.
Seoul rose by 0.941 TP3T, and by detailed region, the increases were in the order of Gangbuk (1.041 TP3T), Southeast (0.941 TP3T), Gangnam (0.851 TP3T), Southwest (0.781 TP3T), Central (0.831 TP3T), and Northwest (0.721 TP3T). By district, Nowon-gu (1.671 TP3T), Seongbuk-gu (1.601 TP3T), Seongdong-gu (1.231 TP3T), Dobong-gu (1.151 TP3T), and Gangbuk-gu (1.111 TP3T) showed high growth rates, while Gangdong-gu (1.271 TP3T), Songpa-gu (1.261 TP3T), Geumcheon-gu (1.021 TP3T), and Yeongdeungpo-gu (1.001 TP3T) also rose.
Monthly rent prices in Gyeonggi Province rose by 0.521 TP3T and in Incheon by 0.371 TP3T, with Hwaseong Dongtan-gu (1.541 TP3T), Yongin Giheung-gu (1.351 TP3T), and Gwangmyeong-si (1.301 TP3T) leading the increase in Gyeonggi. In the provinces, Ulsan recorded the highest growth rate at 0.541 TP3T, followed by Sejong (0.361 TP3T), Jeonbuk (0.231 TP3T), Gyeongnam (0.191 TP3T), Busan (0.181 TP3T), and Daejeon (0.111 TP3T). Conversely, Jeju fell by 0.131 TP3T. Notably, the integrated apartment monthly rent index rose by 0.471 TP3T nationwide, 0.771 TP3T in the Seoul metropolitan area, and 1.121 TP3T in Seoul, highlighting a prominent upward trend centered on apartments in the monthly rent market as well.
<Comprehensive Analysis>
The housing market in July showed that while sales, Jeonse, and monthly rent prices all rose, the differentiation between the metropolitan area and the provinces became more pronounced.
In particular, Seoul significantly outperformed the national average in all three indices, with sales at 1.091 TP3T, Jeonse at 1.031 TP3T, and monthly rent at 0.941 TP3T; Gyeonggi also showed an upward trend with sales at 0.651 TP3T, Jeonse at 0.551 TP3T, and monthly rent at 0.521 TP3T. On the other hand, the recovery in provincial areas was relatively limited, with sales reaching only 0.011 TP3T.
However, even within the provinces, some regions such as Ulsan, Jeonbuk, and Sejong are showing signs of improvement in both the sales and rental markets, indicating that regional differentiation continues. Going forward, while housing preferences and rental demand in key areas of Seoul and the metropolitan area will continue to drive price trends, it is judged that the provinces will continue to experience mixed trends of rise and fall depending on regional supply and demand and living conditions.